
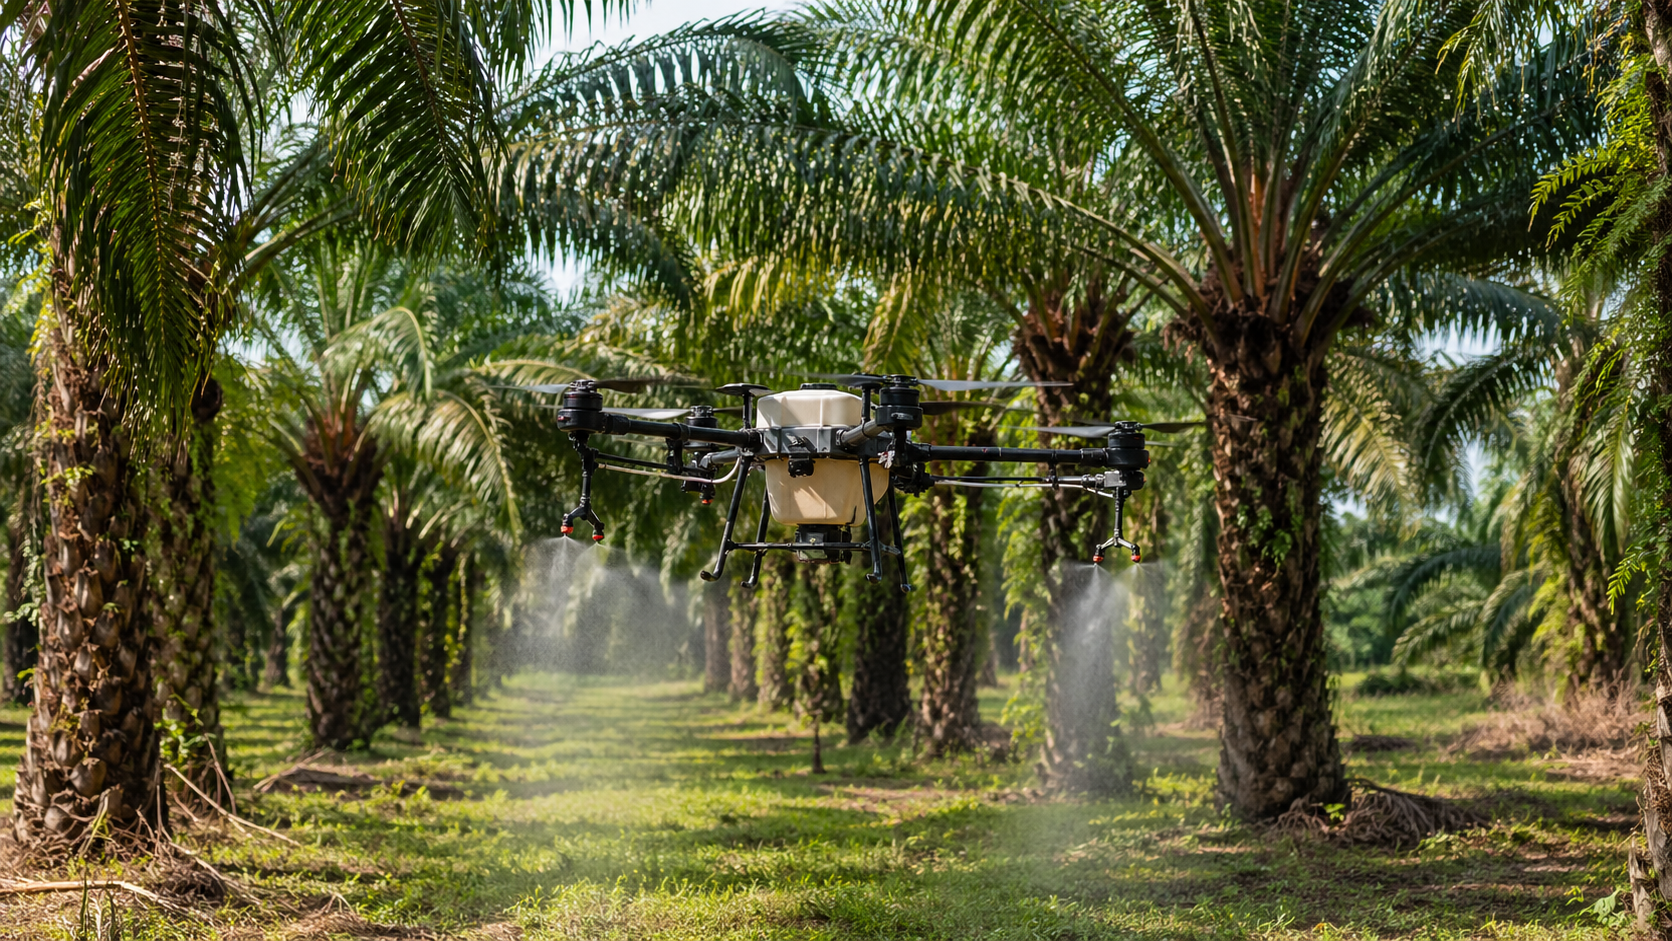
The purchase price of an agriculture drone does not tell you what spraying will cost per hectare. A lower-priced aircraft can be expensive to operate if utilization is low, batteries are undersized, parts are difficult to obtain, or downtime interrupts a short treatment window. A higher-capacity system can also be a poor investment if the farm does not have enough annual work to use it efficiently.
A useful financial comparison separates capital cost, operating cost, treatment inputs, and business value. This guide provides a calculation framework that buyers can adapt to local labor, energy, transport, chemical, financing, and regulatory conditions.
Important
All monetary figures in the worked example are illustrative planning inputs, not Stroni prices, customer results, or guaranteed savings. Replace every input with a verified local quotation or operating record before making an investment decision.
Start With Four Different Cost Measures
Purchase price - What it answers: What must be paid for the selected package; Common mistake: Comparing aircraft-only price with a complete field package
Landed investment - What it answers: What it costs to place a usable system in your operation; Common mistake: Ignoring freight, import, training, spares, and field power
Operating cost per hectare - What it answers: What each treated hectare consumes over time; Common mistake: Dividing price by hectares while excluding batteries, labor, and downtime
ROI and payback - What it answers: Whether annual benefits justify the investment; Common mistake: Using unverified chemical or yield savings as guaranteed income
1. Calculate the Complete Landed Investment
Landed investment formula
Aircraft package + batteries + chargers + field power + starter spares + training + freight + import costs + setup costs
Define the package before comparing suppliers. One quote may include a remote controller, multiple batteries, fast charging, spreading hardware, tools, and spare parts. Another may show only the aircraft. The lower headline figure is not necessarily the lower deployed cost.
Import duties, taxes, broker fees, inland transport, registration, insurance, and compliance costs vary by country and buyer. Confirm them locally. The manufacturer can provide product and shipment information, but the importer should validate final classification and obligations with the relevant authorities and service providers.
2. Convert Capital Items Into a Cost per Hectare
Capital allocation formula
Capital cost per hectare = net capital cost / expected productive lifetime hectares
Net capital cost is the purchase and setup cost minus any realistic resale value. Productive lifetime hectares should be based on the operating plan and maintenance assumptions, not a marketing maximum. If you cannot estimate lifetime hectares confidently, calculate several scenarios.
Batteries should usually be modeled separately from the aircraft because their replacement cycle depends on chemistry, temperature, charging practice, storage, depth of discharge, load, and field handling. Allocate the battery and charger investment over a conservative expected workload, then update the model as real cycle and hectare records become available.
3. Add Variable Operating Costs
The operating cost per hectare should include every resource that changes with field work or must be supported by field volume. Typical categories are:
Aircraft depreciation or capital allocation
Battery and charger allocation
Maintenance, wear parts, repairs, and spare-parts consumption
Pilot, mixer, loader, observer, technician, and administrative labor
Electricity, generator fuel, and generator maintenance
Water, mixing equipment, cleaning, and personal protective equipment where applicable
Vehicle, trailer, site travel, lodging, and mobilization
Software, communications, mapping, or data services
Insurance, registration, permits, training renewal, and compliance administration
Financing cost and a reasonable allowance for downtime or weather disruption
Operating cost formula
Drone operating cost per hectare = total aircraft-related annual cost / annual hectares treated
Should Chemical Cost Be Included?
Track treatment chemicals separately from drone operating cost. If the same product and dose per hectare are used in both the baseline method and the drone method, the chemical cost appears on both sides and does not create savings. Keeping it separate prevents the equipment comparison from being distorted by a large input cost that may not change.
If the agronomic plan allows the drone workflow to change application volume, treated area, or chemical quantity, include that difference only after it is validated by the product label, local agronomic guidance, and measured field records. Do not assume that lower water volume automatically means lower active-ingredient use.
Worked Example: Illustrative Cost per Hectare
The example below demonstrates the method. It is not a quotation and does not represent a specific Stroni customer. All values are in US dollars and should be replaced with local data.
Aircraft and core equipment - Illustrative assumption: $12,000 allocated over 12,000 productive ha; Calculated cost/ha: $1.00
Battery and charging system - Illustrative assumption: $4,000 allocated over 4,000 productive ha; Calculated cost/ha: $1.00
Maintenance and spare parts - Illustrative assumption: Estimated from service plan and wear items; Calculated cost/ha: $0.80
Field labor - Illustrative assumption: Pilot and support labor divided by completed hectares; Calculated cost/ha: $2.00
Electricity or generator cost - Illustrative assumption: Charging energy, fuel, and generator service; Calculated cost/ha: $0.30
Transport and administration - Illustrative assumption: Vehicle, mobilization, insurance, and compliance allocation; Calculated cost/ha: $0.90
Illustrative drone operating cost - Illustrative assumption: Excludes treatment chemical; Calculated cost/ha: $6.00/ha
At 2,500 treated hectares per year, the illustrative operating cost is $15,000 per year. The calculation is $6.00/ha x 2,500 ha. If actual annual utilization falls, fixed costs are spread across fewer hectares and cost per hectare increases. If utilization rises without adding disproportionate labor, transport, repair, or battery cost, the unit cost may decrease.
4. Compare With the Current Method on the Same Basis
Build a baseline cost per hectare for the current method using the same boundaries. Include labor, equipment depreciation or contractor fees, fuel, transport, water logistics, field damage where measurable, downtime, and relevant administration. Keep chemicals separate unless the chemical quantity genuinely changes.
Operational saving per hectare
Comparable baseline operating cost per hectare - drone operating cost per hectare
Suppose the comparable baseline method costs $9.50/ha and the illustrative drone model costs $6.00/ha. The modeled operational saving is $3.50/ha. That result is useful only if both figures include equivalent activities, service quality, and treatment outcomes.
5. Calculate Annual Benefit and Simple Payback
Annual net benefit
(Operational saving per hectare x annual hectares) + verified added revenue - added annual fixed costs
Simple payback period
Total initial investment / annual net benefit
Continuing the illustrative example, a $3.50/ha operational saving across 2,500 ha produces $8,750 in annual benefit before financing, tax, additional fixed cost, or downtime adjustments. A $16,000 initial aircraft, battery, and charging investment divided by $8,750 gives a simple payback estimate of about 1.83 years.
This is not a forecast. Real payback can be longer, shorter, or absent. It changes with utilization, replacement cycles, financing, weather, regulation, crop demand, contract pricing, field efficiency, and treatment outcomes.
Utilization Sensitivity: Why Annual Hectares Matter
1,000 ha - Illustrative saving: $3.50/ha; Annual benefit: $3,500; Simple payback on $16,000: 4.57 years
2,500 ha - Illustrative saving: $3.50/ha; Annual benefit: $8,750; Simple payback on $16,000: 1.83 years
5,000 ha - Illustrative saving: $3.50/ha; Annual benefit: $17,500; Simple payback on $16,000: 0.91 years
This sensitivity table holds the per-hectare saving constant to show the effect of utilization. In reality, labor, travel, battery replacement, maintenance, and downtime may change at higher volume. Recalculate the full model for each scenario instead of assuming every cost remains linear.
For Contractors: Add Price, Capacity, and Seasonal Risk
A spraying contractor should distinguish cost per hectare from selling price per hectare. Revenue must also cover sales effort, non-billable travel, weather cancellations, bad debt, financing, management, taxes, and profit.
Contractor contribution per hectare
Selling price per hectare - variable operating cost per hectare
Break-even hectares
Annual fixed costs / contribution per hectare
Do not build the plan on the full number of calendar days in the season. Estimate workable weather days, operating hours per day, site travel, customer scheduling, and collection risk. A conservative capacity plan is more valuable than an attractive model that depends on perfect utilization.
Data to Record During a Pilot
The fastest way to improve the calculator is to replace assumptions with your own field records. During a pilot, record:
Field and crop type, terrain, obstacles, and weather
Application rate, total liquid used, and completed hectares
Productive flight time, turns, refill time, battery time, and delays
Battery identity, charge cycles, temperature, and charging energy or generator fuel
Crew size, paid hours, travel time, and distance
Parts used, faults, cleaning time, and maintenance actions
Treatment quality checks and any repeat work
Customer price or avoided baseline cost, using the same cost boundary
After several representative days, calculate a low, expected, and high case. Use the low case for cash planning, the expected case for normal budgeting, and the high case only as upside.
Common ROI Mistakes
Using a maximum hectares-per-hour claim as a full-day production figure
Treating the aircraft-only price as the complete investment
Ignoring battery replacement, spare parts, field power, and transport
Assuming chemical savings without an agronomic and label-compliant basis
Counting yield improvement without a controlled comparison or reliable records
Using one cost model for both open fields and complex orchards
Ignoring weather, training, registration, insurance, and seasonal downtime
Calculating payback from revenue instead of net benefit
How Stroni Can Help You Build a More Relevant Cost Model
Stroni supplies civil Agriculture UAV Platforms and can discuss aircraft capacity, spraying or spreading configuration, batteries, charging, starter spare parts, training, and project or distributor requirements. A useful commercial recommendation starts with the operating conditions, not a generic price list.
Send us your country, crop, application rate, typical field size and terrain, annual hectares, crew cost, available power, and preferred tank capacity. We can review the requirement and respond by email with the configuration questions needed for a more realistic equipment and workflow estimate.
Related Stroni Resources
About the Author:Wei Chen is the Chief UAV Engineer at Stroni, focusing on the architectural design and flight control system optimization of industrial multi-rotor platforms. Learn more →
Frequently Asked Questions
What is this article about?
+
Calculate agriculture drone cost per hectare using aircraft, batteries, maintenance, labor, energy, transport, and annual utilization, with a transparent ROI and payback example.
Who is this for?
+
It is written for teams planning, operating, or scaling enterprise drone workflows.
Where can I find related examples?
+
Use the related case studies and solutions on this page to review similar field applications.
Continue Exploring
Continue Exploring
Keep the momentum going with a few related reads selected to extend this topic into strategy, deployment, and practical field use.
Featured Read
How Much Does an Agricultural Spraying Drone Cost in 2026? Complete Price Guide
Agriculture Drones · Jul 3, 2026
Recommended
Agriculture Drone Payloads Explained: Spraying, Spreading, Mapping and Multispectral Imaging
Agriculture Drones · Jul 31, 2026
Recommended
How Agricultural Spraying Drones Work: From Route Planning to Droplet Deposition
Agriculture Drones · Jul 31, 2026
Recommended
Agriculture Drones in China: Technology, Applications and Operating Principles
Agriculture Drones · Jul 31, 2026
Recommended
How Many Hectares Can a 50L Agriculture Drone Spray Per Hour?
Agriculture Drones · Jul 29, 2026

Want more industry insights?
Explore drone applications, implementation playbooks, and operational best practices with our editorial team.